1. What is Azure Monitor?
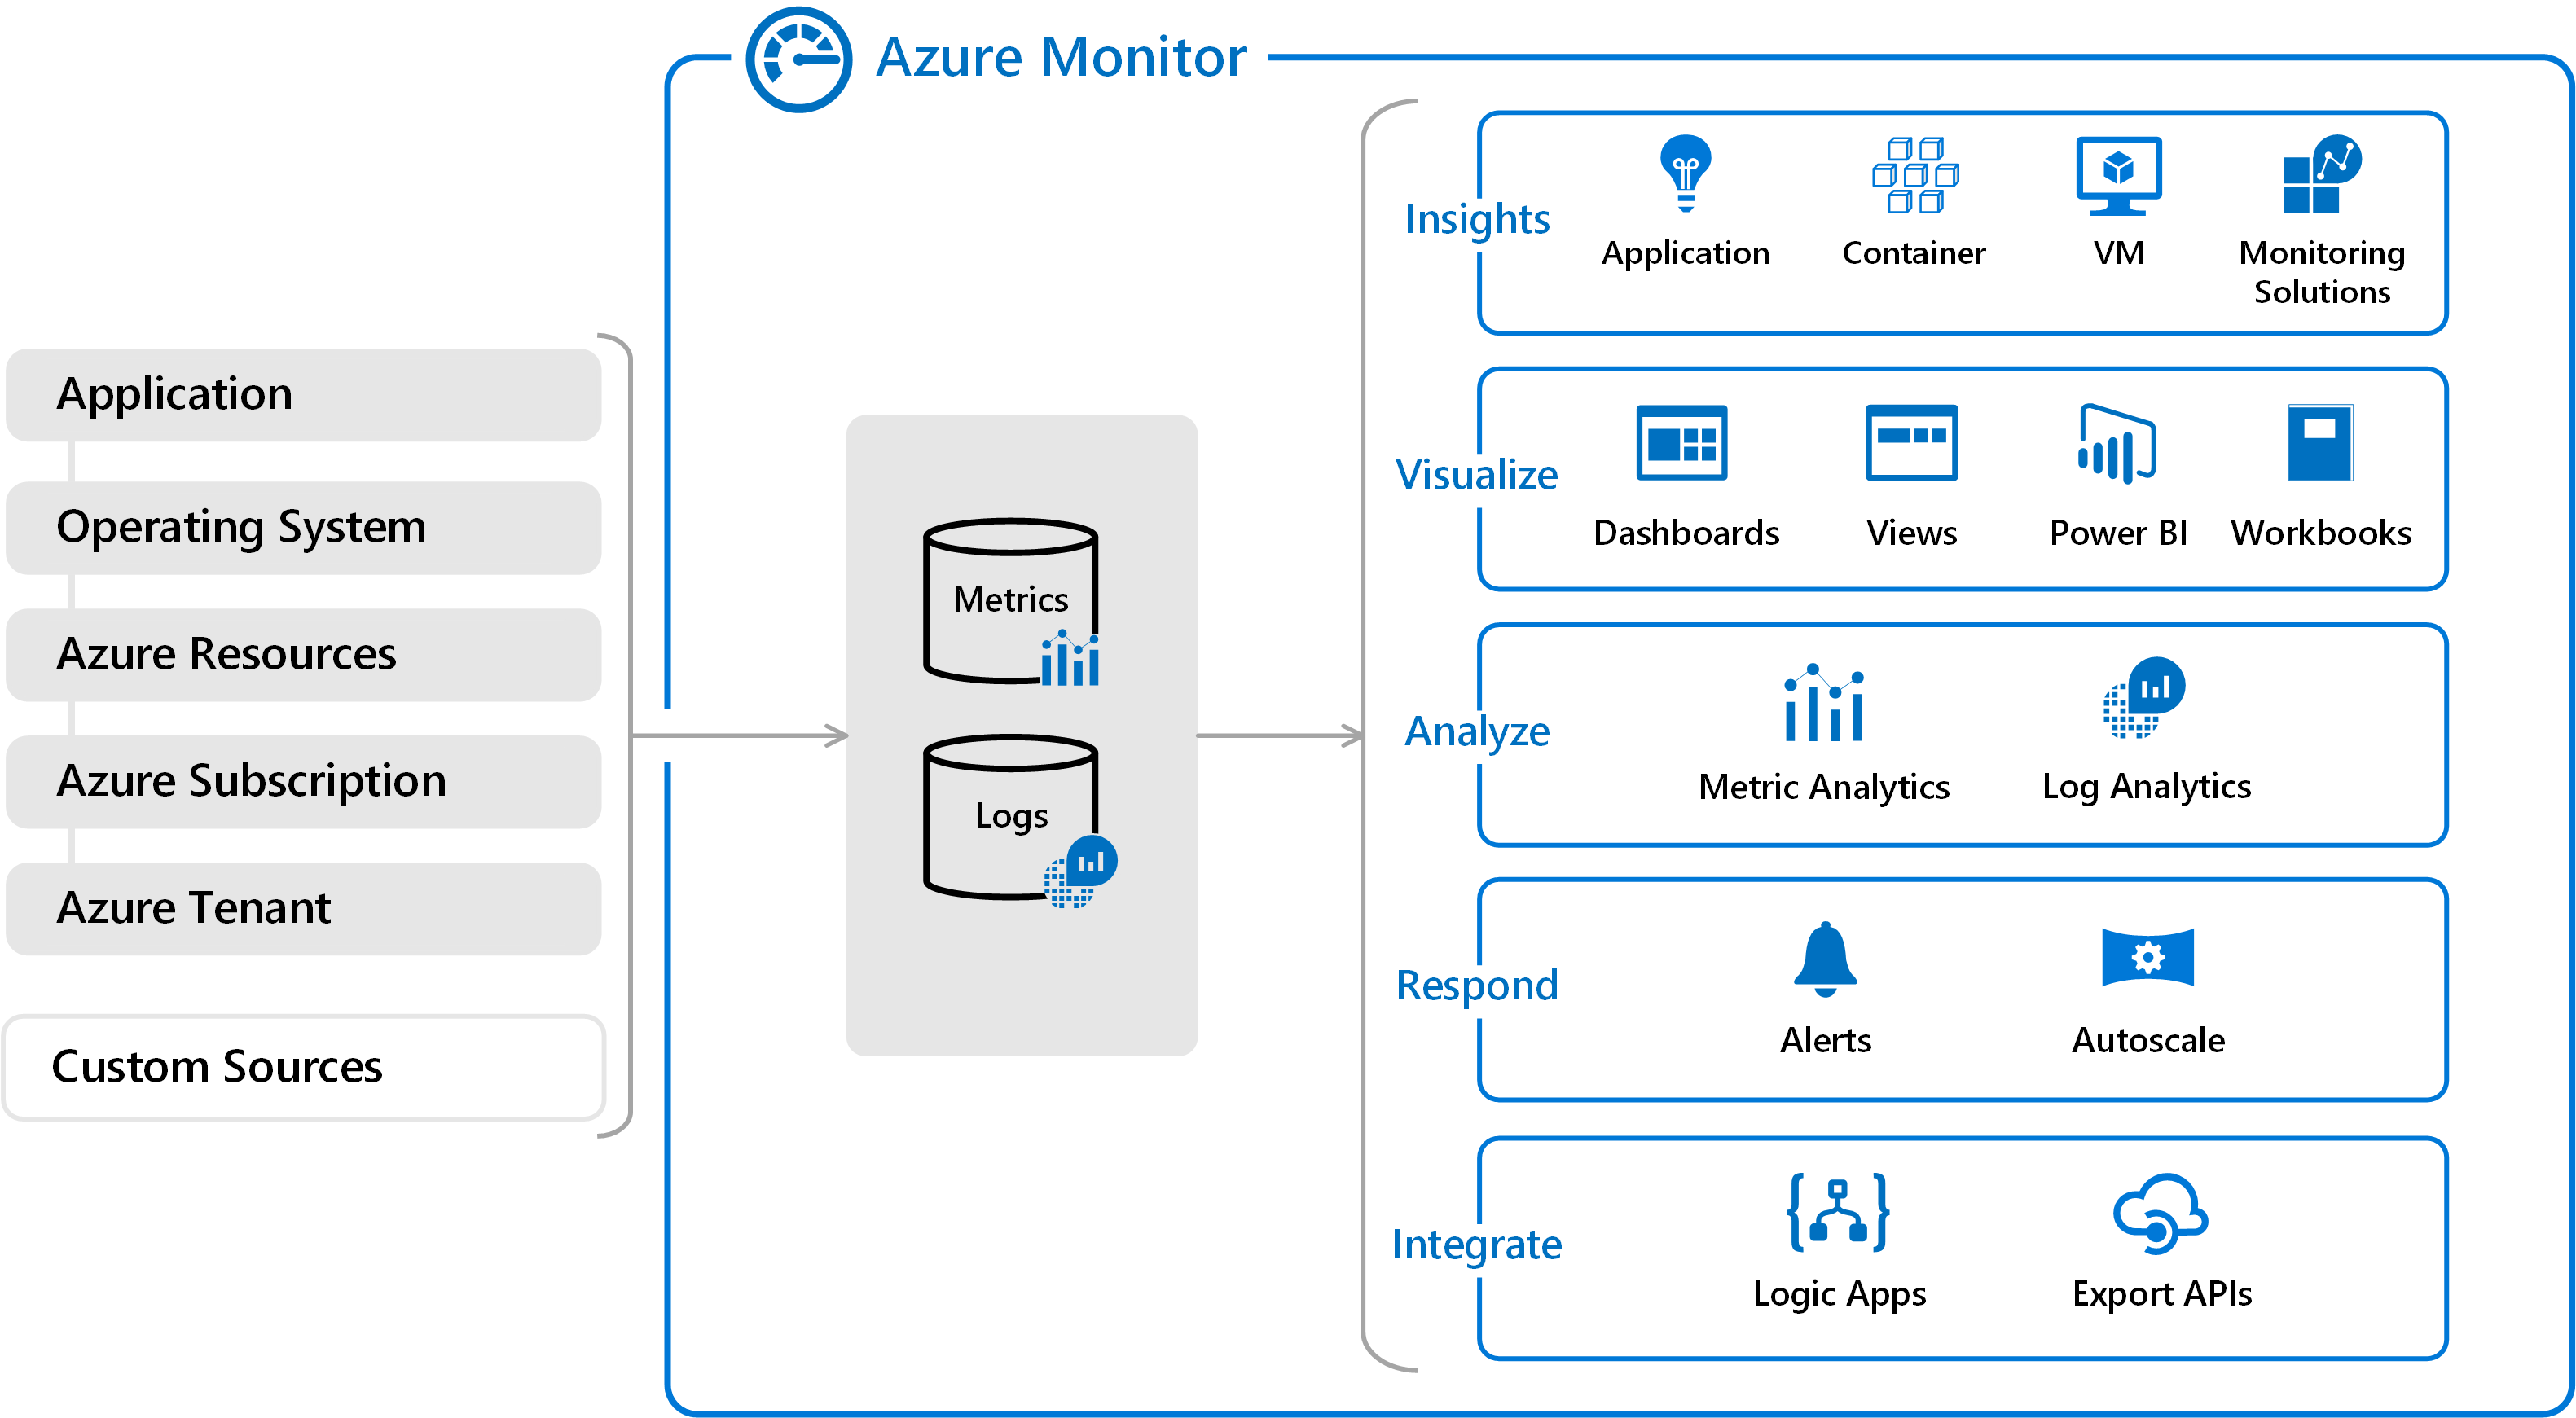
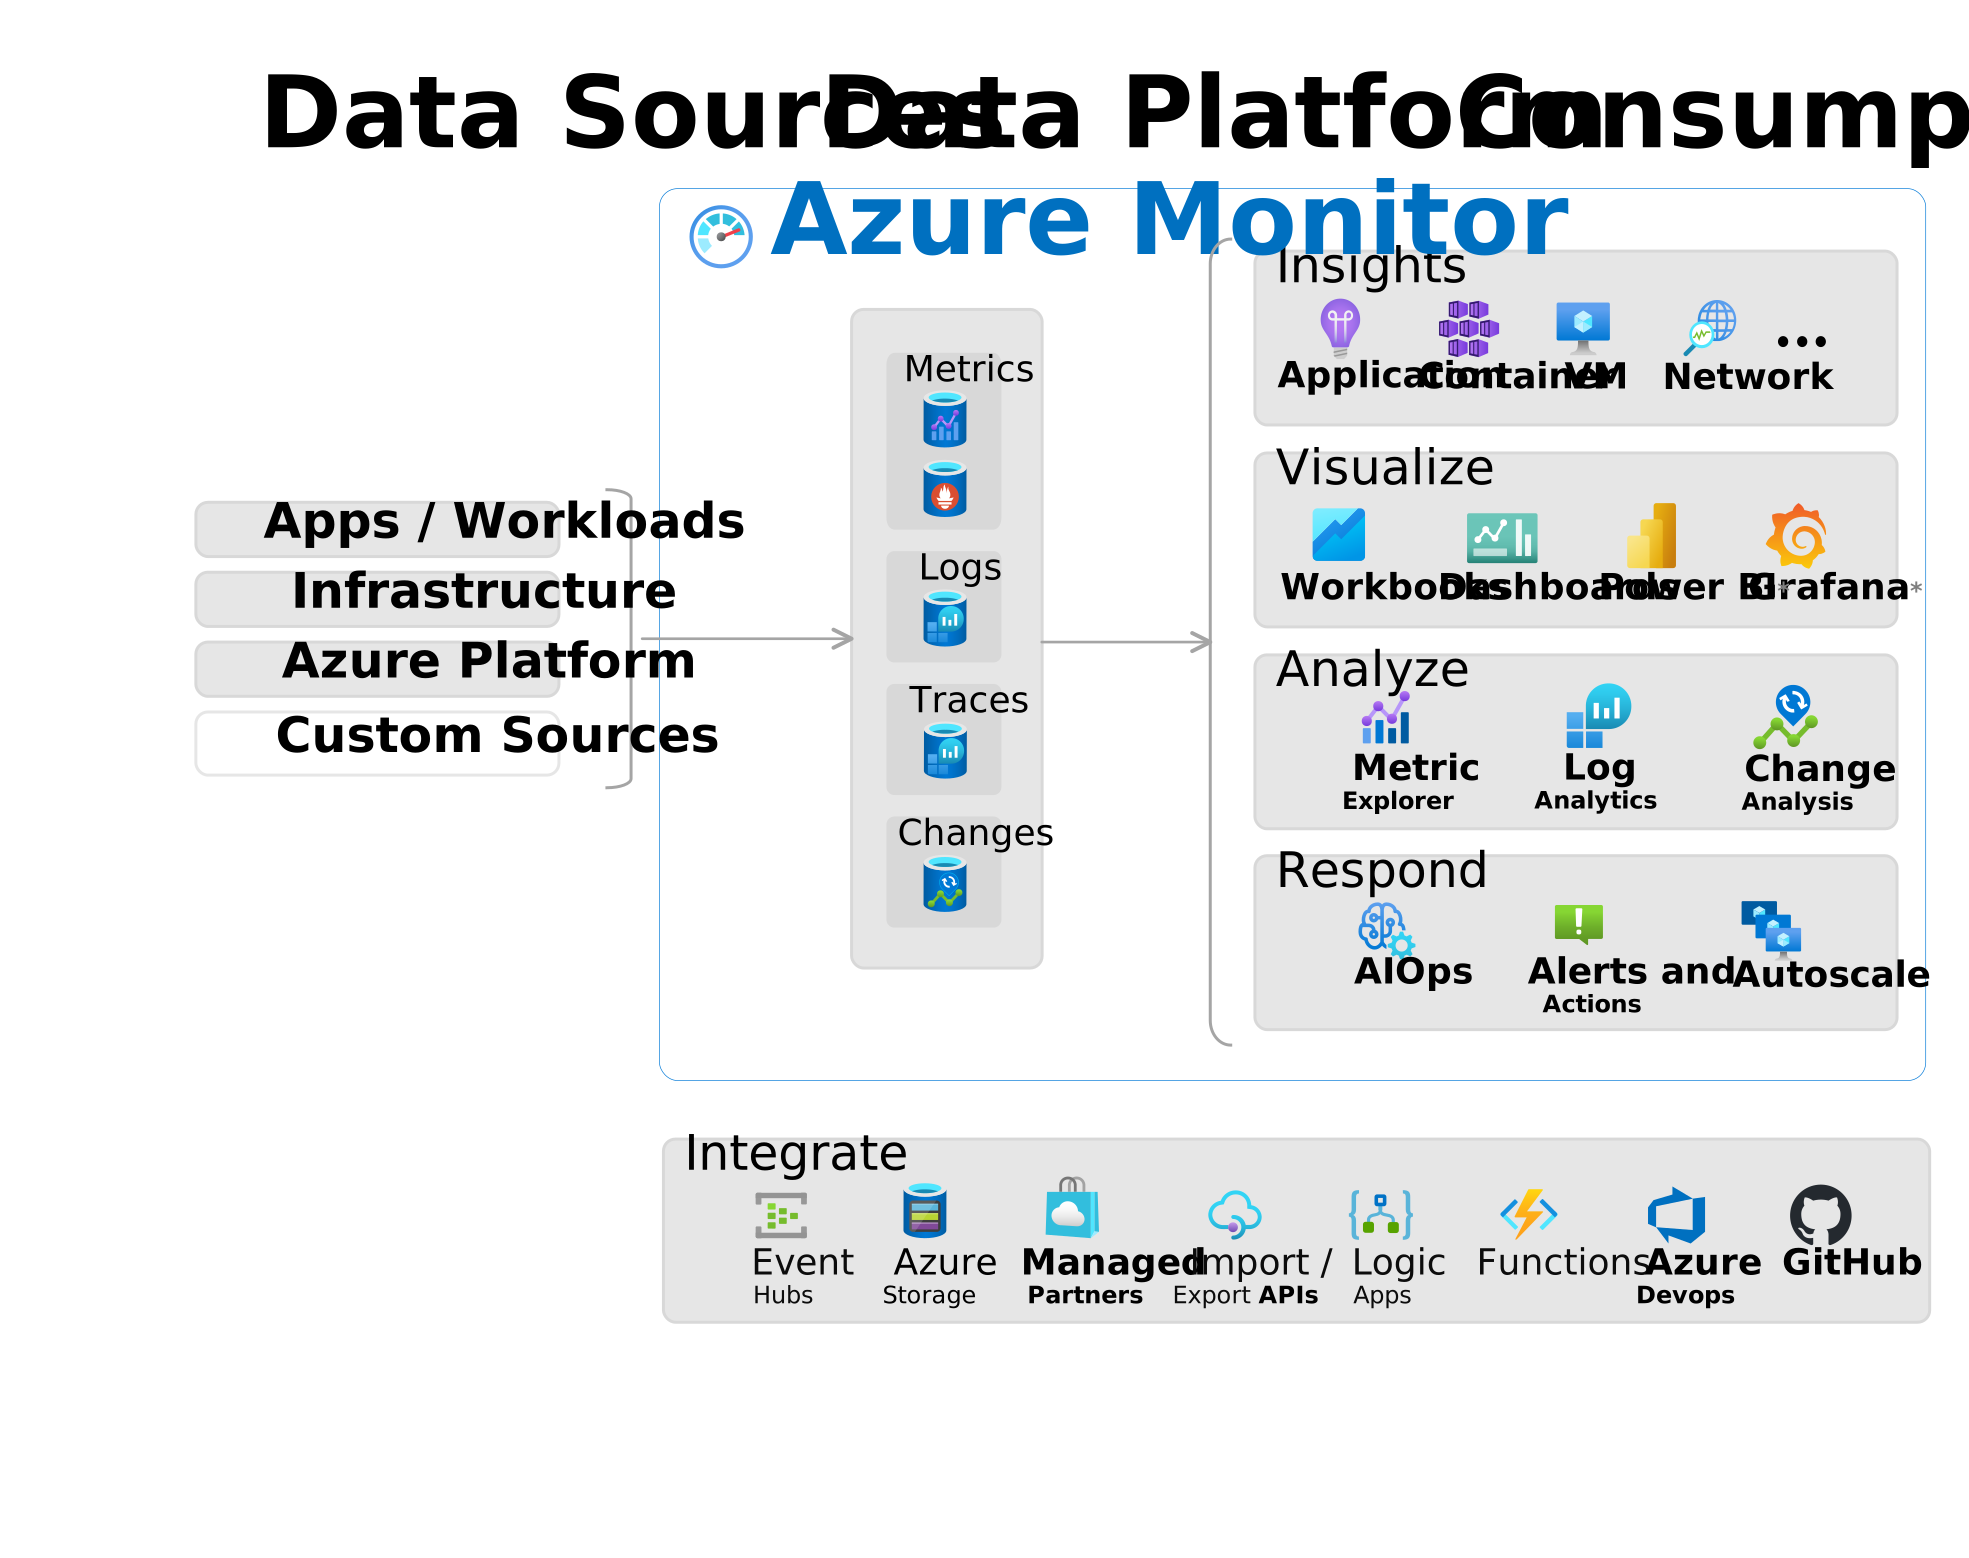
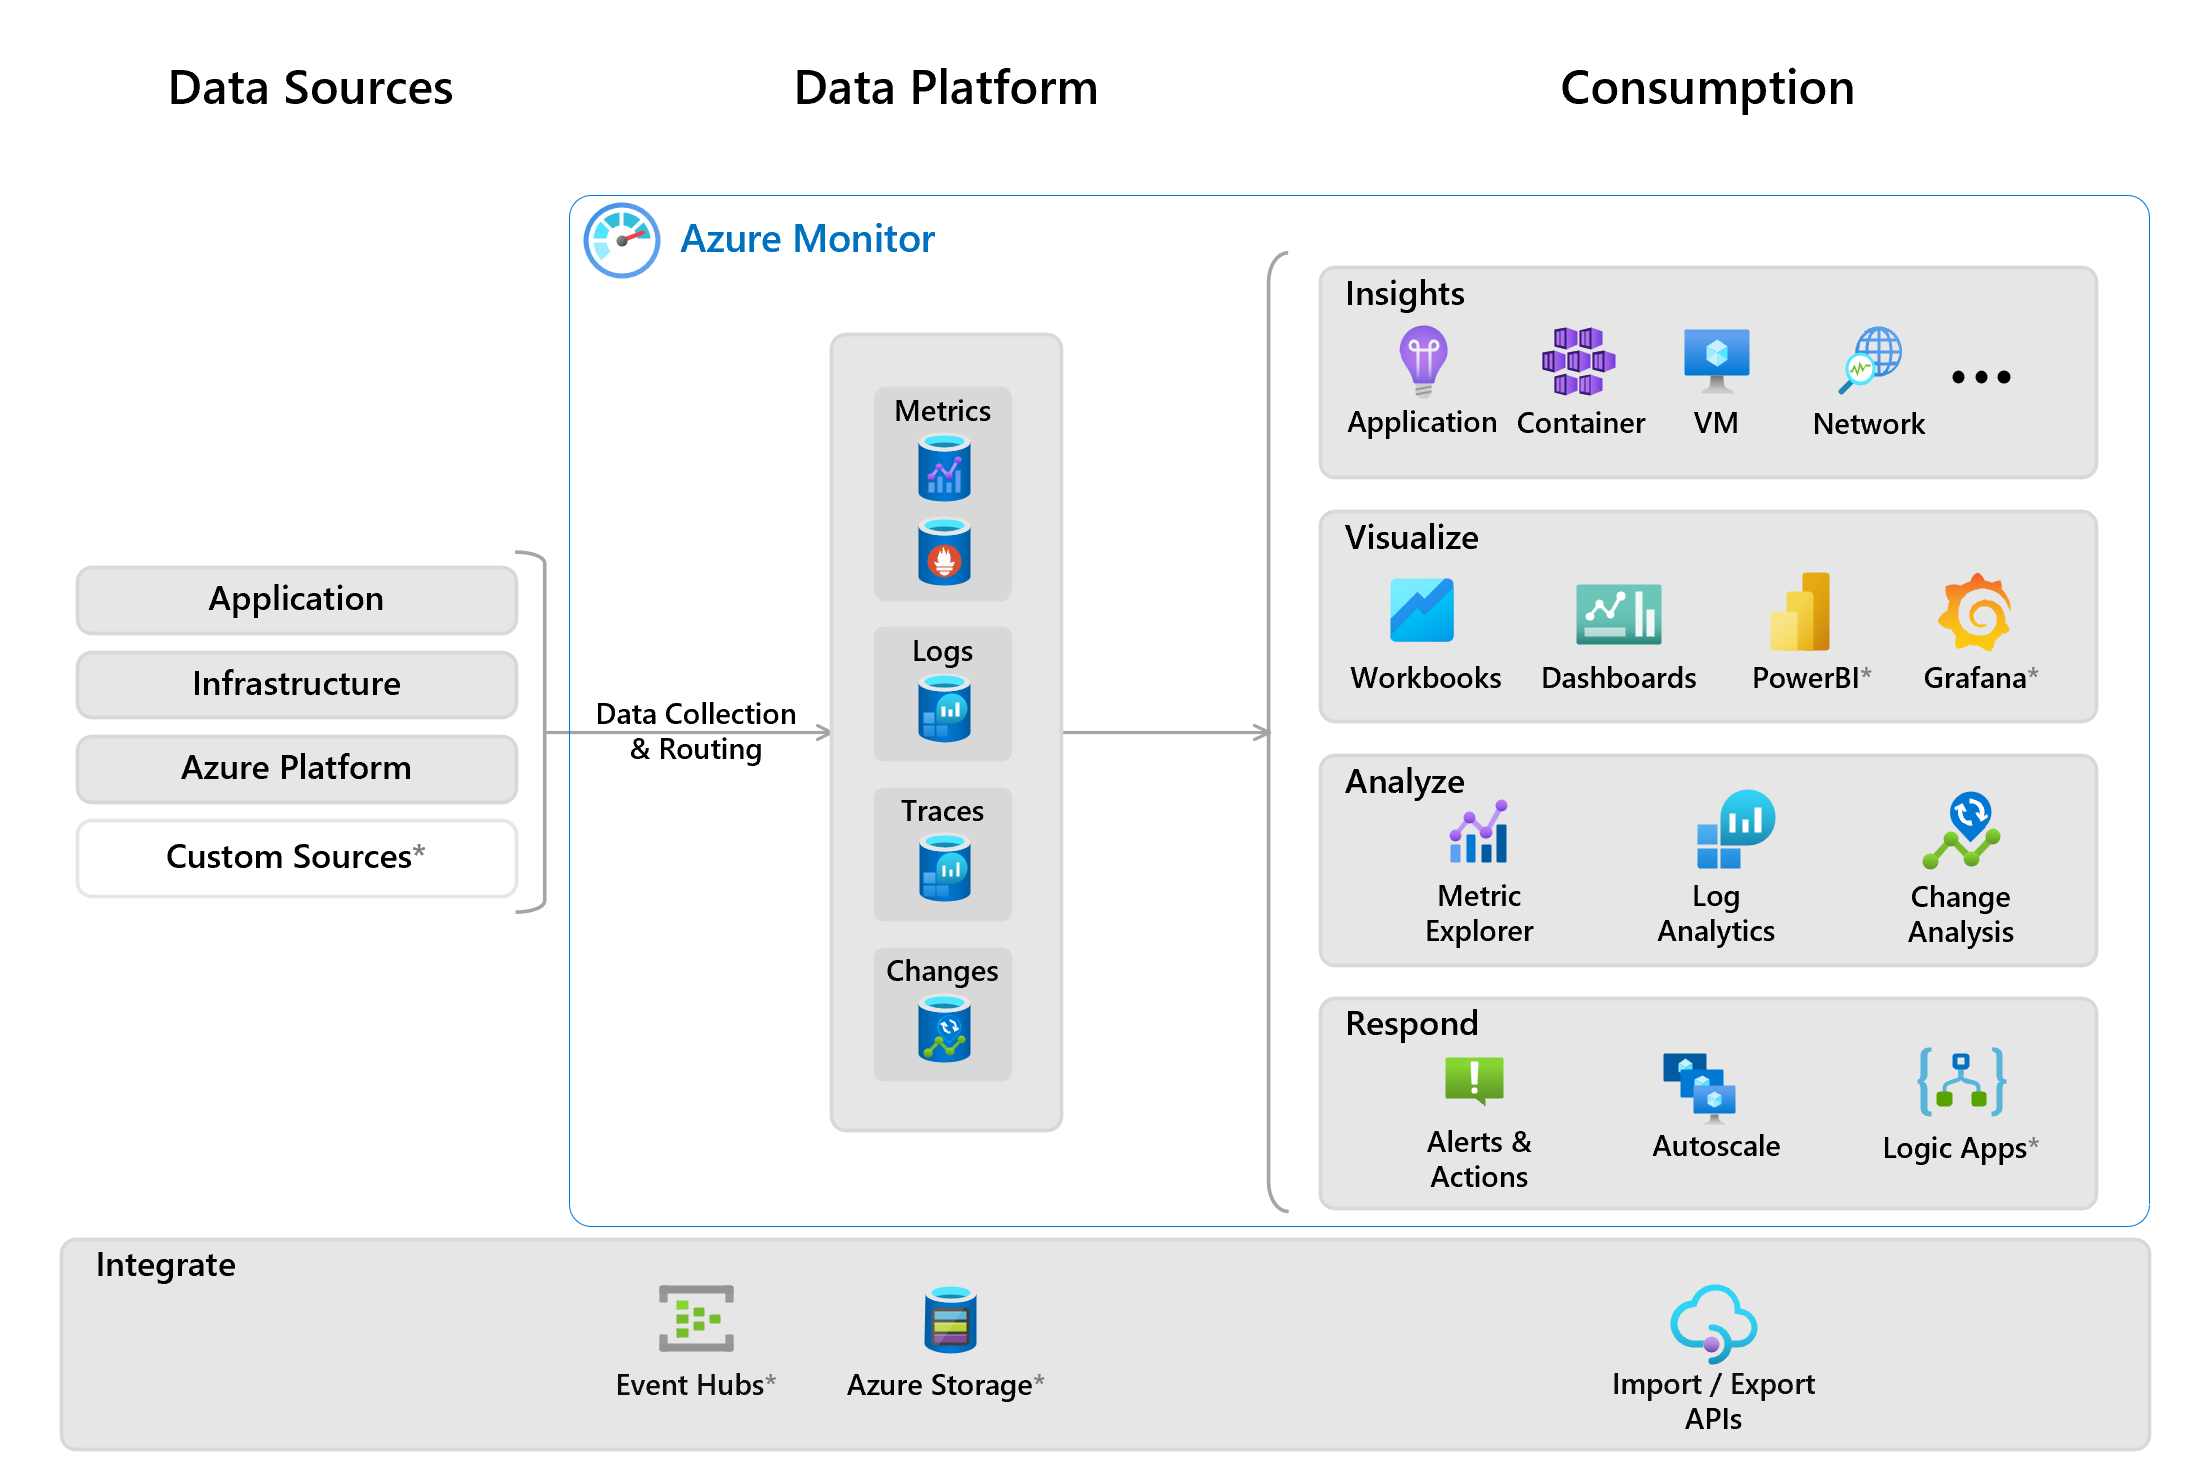
Azure Monitor is a centralized observability platform in Microsoft Azure that collects, analyzes, and acts on metrics, logs, and traces from Azure resources, applications, and infrastructure.
Its main goals are:
- Visibility – understand health, performance, and usage
- Detection – identify issues, anomalies, and security signals
- Response – alert, automate, and integrate with ITSM/SOC tools
- Optimization – improve reliability, cost, and performance
View the diagram on learn.microsoft.com
View the diagram on learn.microsoft.com
2. Data Types in Azure Monitor
Azure Monitor works with three core data types:
Metrics
- Numerical time-series data
- Collected near real-time
- Lightweight and efficient
- Ideal for alerting and dashboards
Examples:
- CPU Percentage
- Memory Usage
- Request Count
- Disk Queue Length
Stored in: Azure Monitor Metrics Database
Logs
- Detailed, queryable records
- Stored in Log Analytics Workspaces
- Queried using Kusto Query Language (KQL)
Examples:
- Application logs
- Audit logs
- Security events
- Custom logs
Stored in: Log Analytics Workspace (Azure Data Explorer backend)
Traces
- End-to-end request tracking
- Used mainly for applications
- Shows dependencies and latency
Examples:
- API call duration
- Dependency failures
- Distributed transaction flow
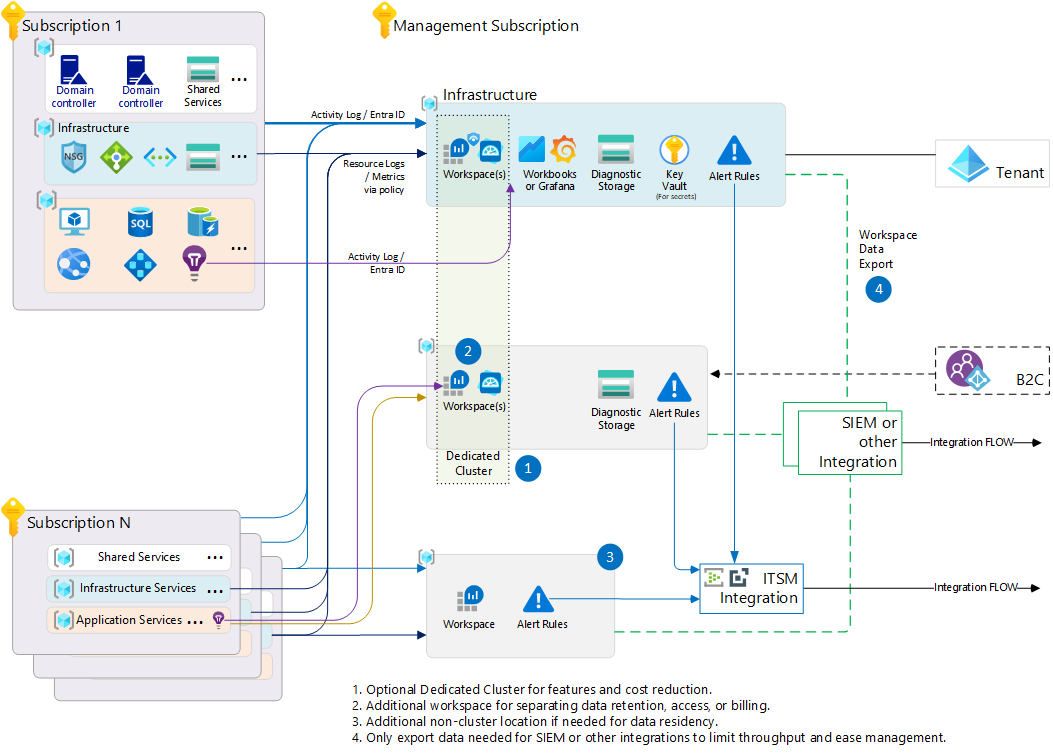
3. Core Azure Monitor Components
View the diagram on learn.microsoft.com
View the diagram on docs.azure.cn
3.1 Log Analytics Workspace
- Central log storage
- Enables KQL queries
- Used by:
- Azure Monitor Logs
- Microsoft Sentinel
- VM Insights
- Container Insights
Typical usage:
- Security investigations
- Root cause analysis
- Compliance auditing
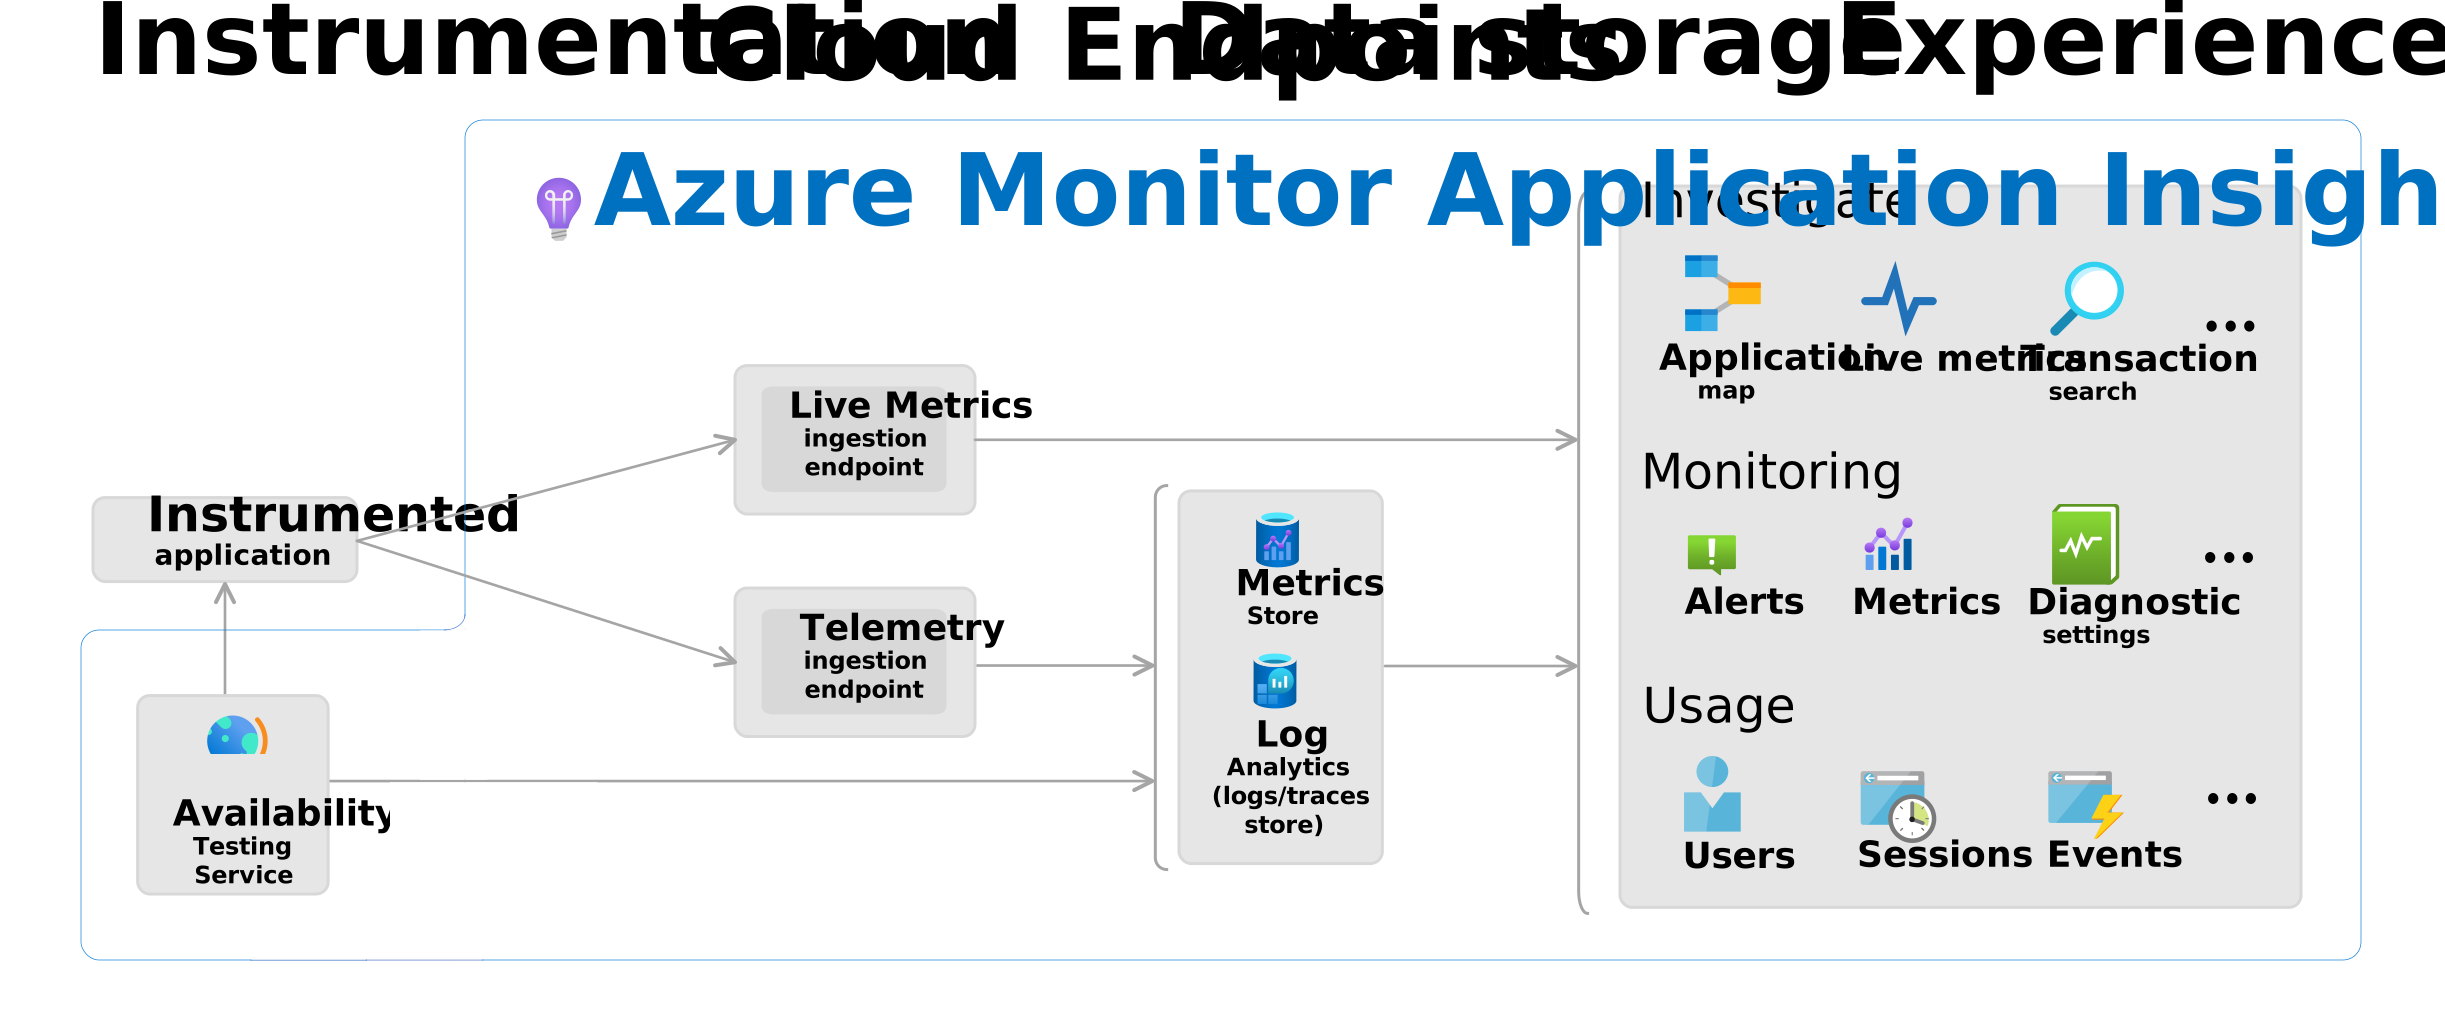
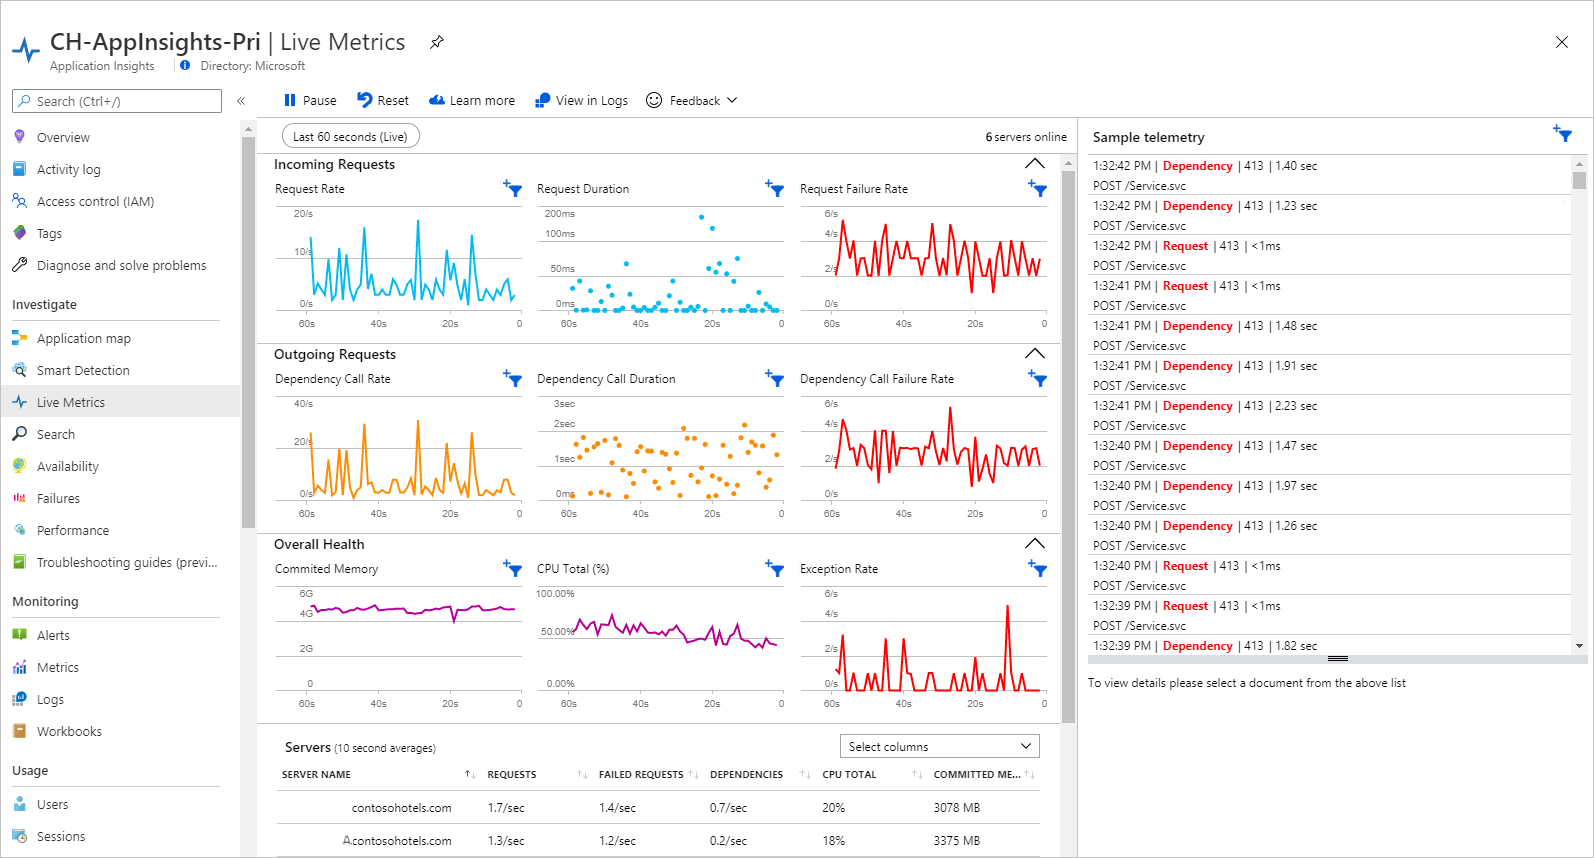
3.2 Application Insights
- Application Performance Monitoring (APM)
- Focused on code-level telemetry
Key features:
- Request/response tracking
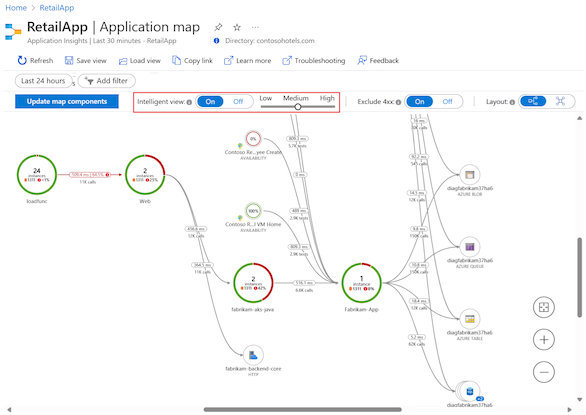
- Dependency monitoring
- Exception analysis
- Availability tests
Common workloads:
- .NET / .NET Core
- Java
- Node.js
- Python
- Azure Functions
- App Service
3.3 Azure Monitor Metrics
- Native metrics from Azure resources
- No additional agent required
- Used for fast alerting
Best for:
- Infrastructure health
- Scaling decisions
- SLA monitoring
3.4 Diagnostic Settings
- Define what data goes where
- Required to export logs/metrics
Destinations:
- Log Analytics Workspace
- Event Hub
- Storage Account
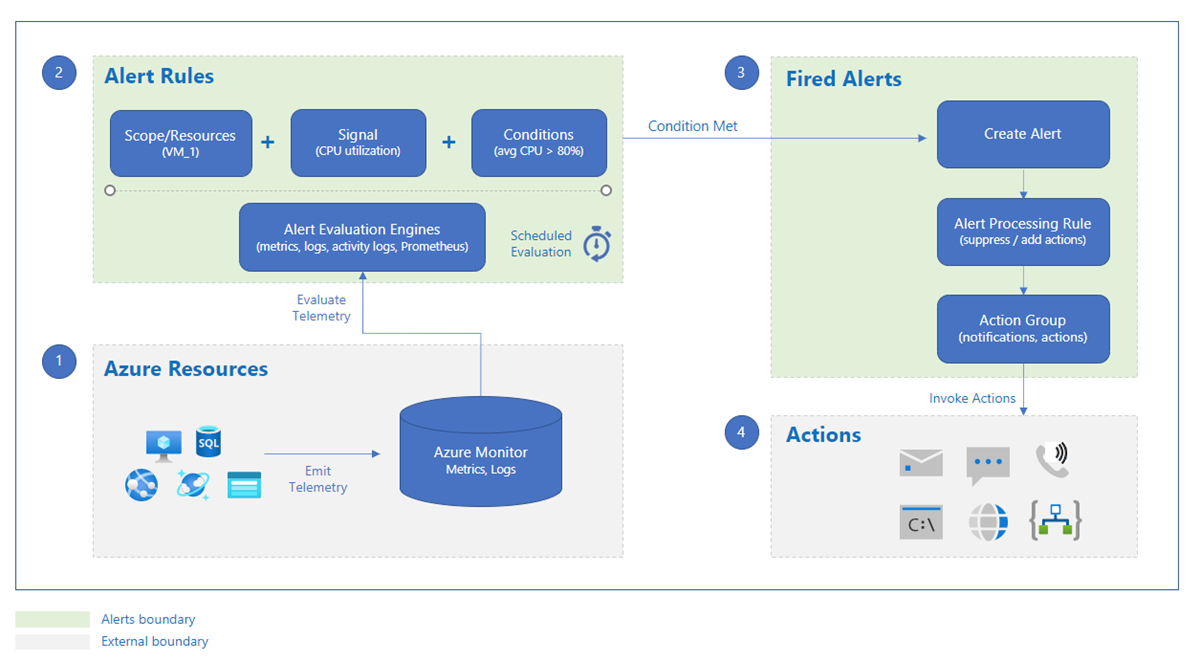
4. Alerting Options
View the diagram on learn.microsoft.com
View the diagram on docs.azure.cn
Azure Monitor supports multiple alert types:
Metric Alerts
- Threshold-based
- Fast (seconds to minutes)
- Ideal for infra monitoring
Example:
CPU > 80% for 5 minutes
Log Alerts
- Based on KQL queries
- Powerful but slower than metric alerts
Example:
SecurityEvent
| where Level == "Error"
Activity Log Alerts
- Subscription-level events
- Control plane monitoring
Examples:
- Resource deletion
- Policy changes
- RBAC modifications
Smart Detection & Anomaly Alerts
- AI-driven
- Automatically detect abnormal behavior
- Mostly tied to Application Insights
5. Automation & Integrations
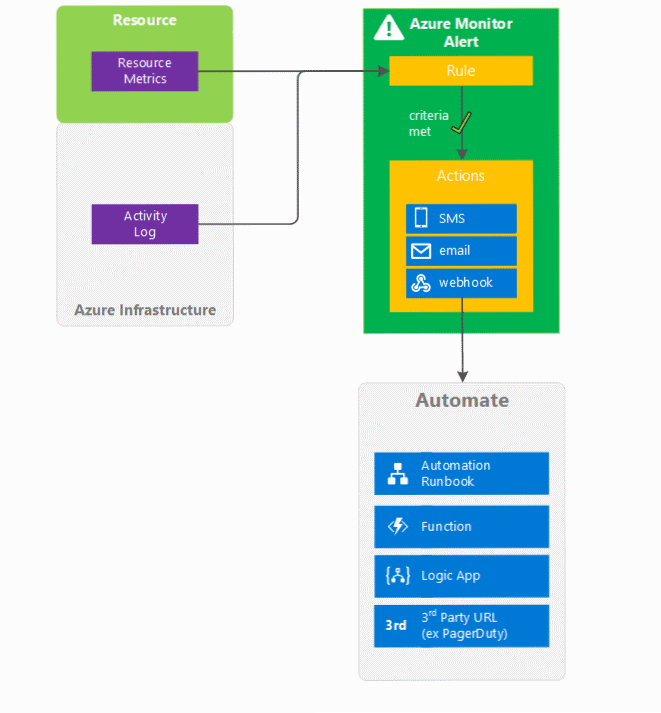
5.1 Action Groups
Used to define what happens when an alert fires.
Supported actions:
- SMS
- Voice
- Webhook
- Azure Logic App
- Azure Function
- ITSM (ServiceNow)
- Azure Automation Runbook
5.2 Azure Automation & Logic Apps
- Auto-remediation
- Scaling actions
- Incident enrichment
- Notifications to Teams / Slack
6. Monitoring Scope Options
Azure Monitor can monitor:
Azure Resources
- VMs
- App Services
- Azure SQL
- Storage Accounts
- Load Balancers
- Azure Front Door
- Azure WAF
Hybrid & On-Prem
- Via Azure Monitor Agent (AMA)
- Windows & Linux
- Syslog & Windows Event Logs
Multi-Cloud & External
- Custom logs via API
- Event Hub ingestion
- Integration with SIEM/SOC tools
7. Cost & Retention Considerations
Key cost drivers:
- Log ingestion volume (GB/day)
- Retention period
- Data export
- Alert evaluations
Best practices:
- Filter logs at source
- Use table-level retention
- Prefer metrics where possible
- Archive old logs to Storage
8. When to Use What (Quick Guide)
| Scenario | Recommended Feature |
|---|---|
| VM health | Metrics + Metric Alerts |
| App performance | Application Insights |
| Security investigation | Log Analytics |
| Compliance auditing | Logs + Activity Logs |
| Auto-healing | Alerts + Logic Apps |
| Pen-test / attack analysis | Logs + WAF logs |
9. Summary
Azure Monitor provides:
- Unified visibility across Azure, apps, and hybrid systems
- Flexible alerting and automation
- Deep diagnostics with logs and traces
- Scalable architecture suitable for enterprise workloads
It is the foundation for:
- Reliability engineering (SRE)
- Security monitoring
- Performance optimization
- Cost control
Azure Monitor – Practical Examples
WAF / Azure Front Door / App Service
(Examples aligned with enterprise / e-commerce / B2C workloads)
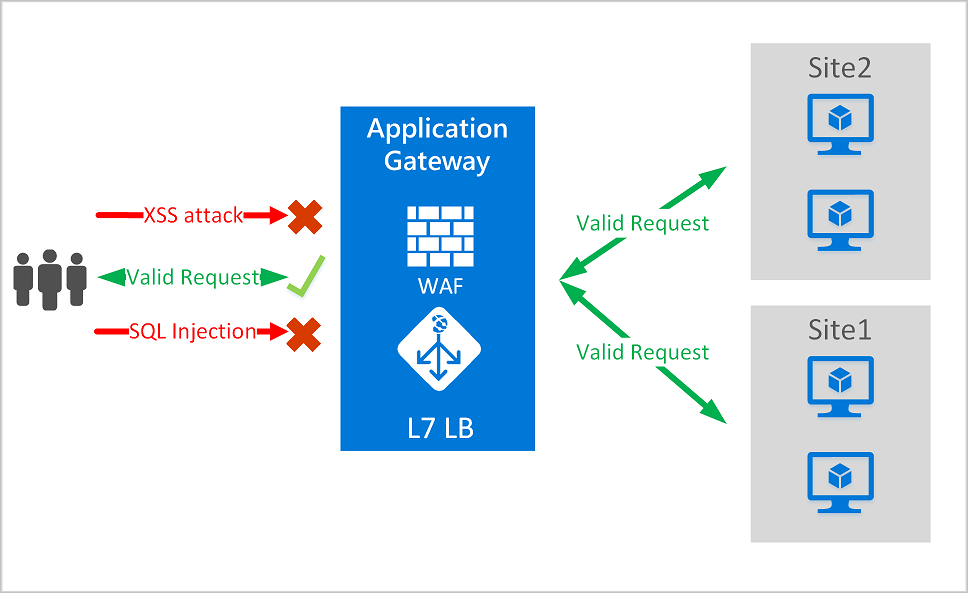
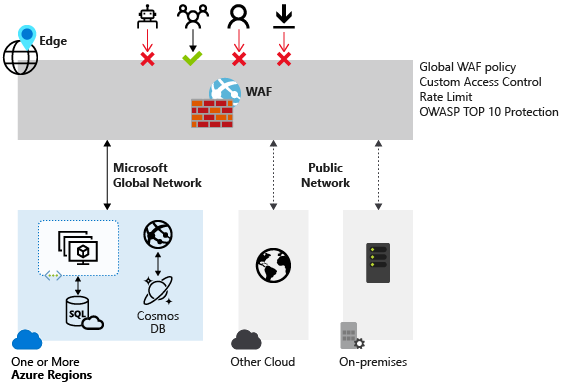
10. Azure WAF Monitoring (Front Door / App Gateway)
View the diagram on learn.microsoft.com
View the diagram on learn.microsoft.com
What to Monitor
From Azure Web Application Firewall (WAF) diagnostics:
ApplicationGatewayFirewallLog(App Gateway)FrontDoorWebApplicationFirewallLog(Front Door)AzureDiagnostics(legacy)
Key signals:
- Blocked vs allowed requests
- OWASP rule hits
- IP reputation & bot traffic
- Geo-location anomalies
- False positives from legitimate reverse proxies
Example: Sudden Spike in Blocked Requests
Scenario:
4000+ requests blocked in a short time window, all coming from a known partner reverse proxy.
KQL – Blocked Requests Overview
AzureDiagnostics
| where Category == "FrontDoorWebApplicationFirewallLog"
| where action_s == "Block"
| summarize Count = count() by clientIP_s, ruleName_s, bin(TimeGenerated, 5m)
| order by Count desc
What this tells you:
- Which IPs are blocked
- Which OWASP rules fired
- Whether this is attack traffic or a false positive
Example: OWASP Rule Analysis
AzureDiagnostics
| where Category == "FrontDoorWebApplicationFirewallLog"
| summarize Hits = count() by ruleSetType_s, ruleId_s, action_s
| order by Hits desc
Use case:
- Tune WAF exclusions
- Decide if a rule should be set to Log instead of Block
Recommended Alerts
- 🚨 Blocked requests > X/min
- 🚨 New source country detected
- 🚨 Spike in rule 942100 / 930120 (SQLi / RCE)
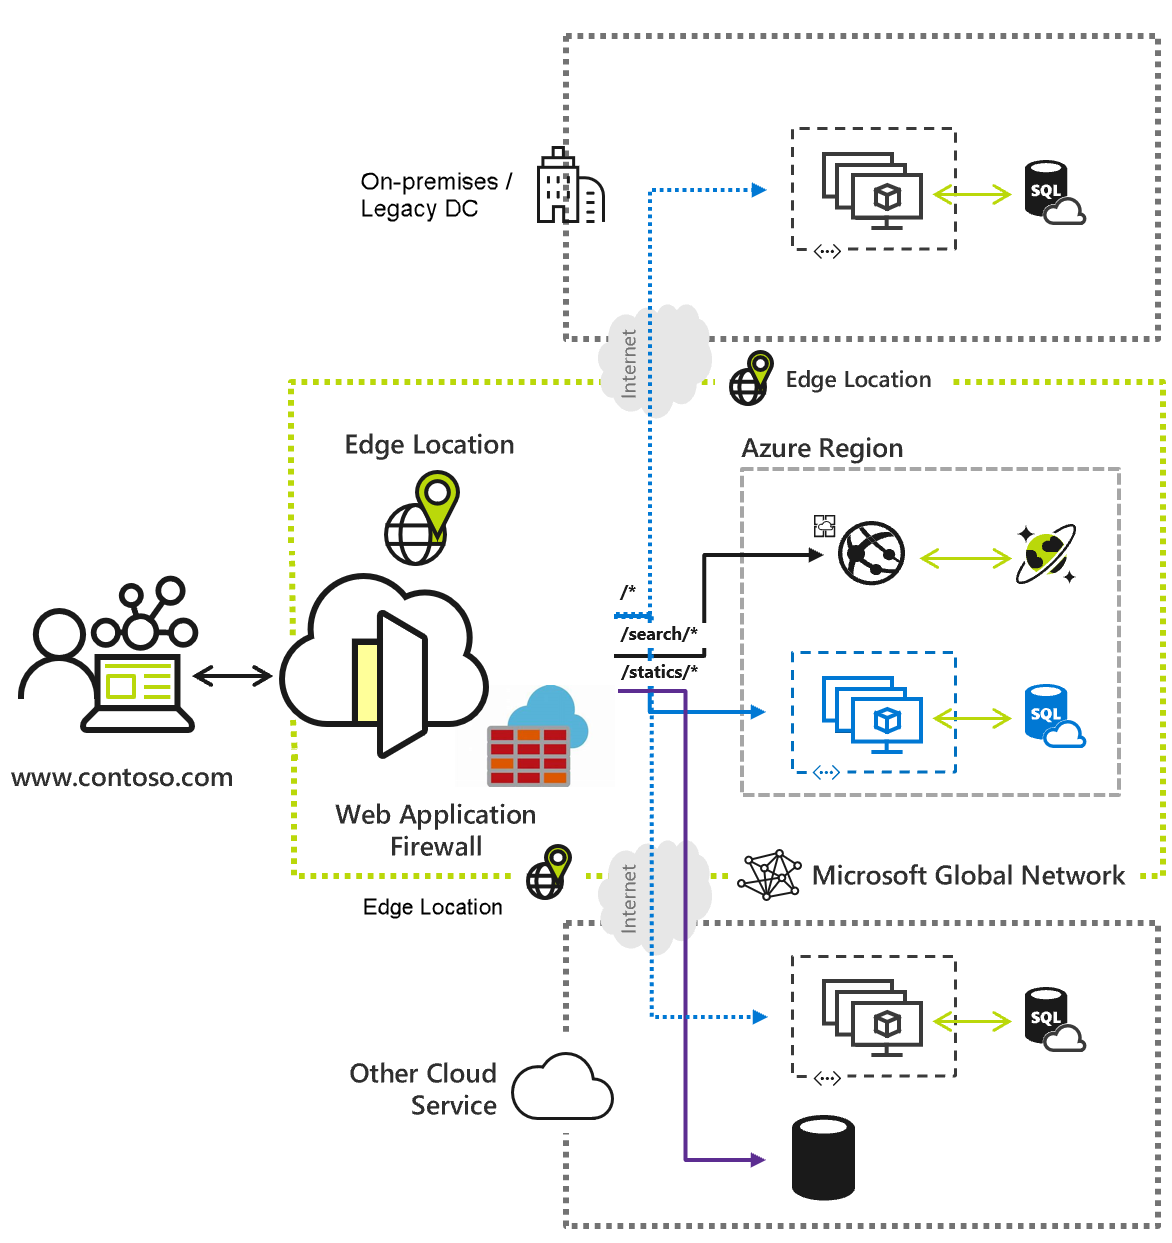
11. Azure Front Door Monitoring
View the diagram on learn.microsoft.com
View the diagram on learn-attachment.microsoft.com
View the diagram on learn-attachment.microsoft.com
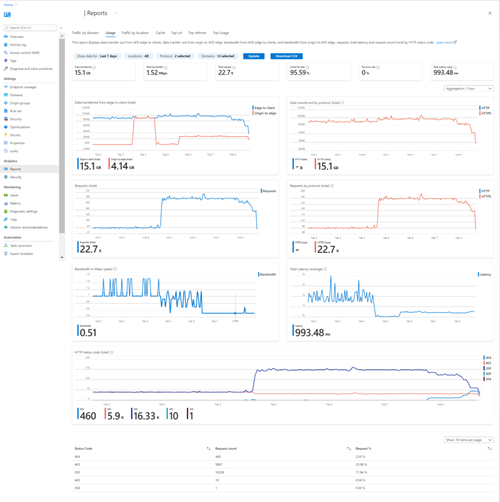
Metrics to Enable
From Azure Front Door Metrics:
- Backend Health Percentage
- Total Requests
- Failed Requests
- Latency (TTFB)
- WAF Blocked Requests
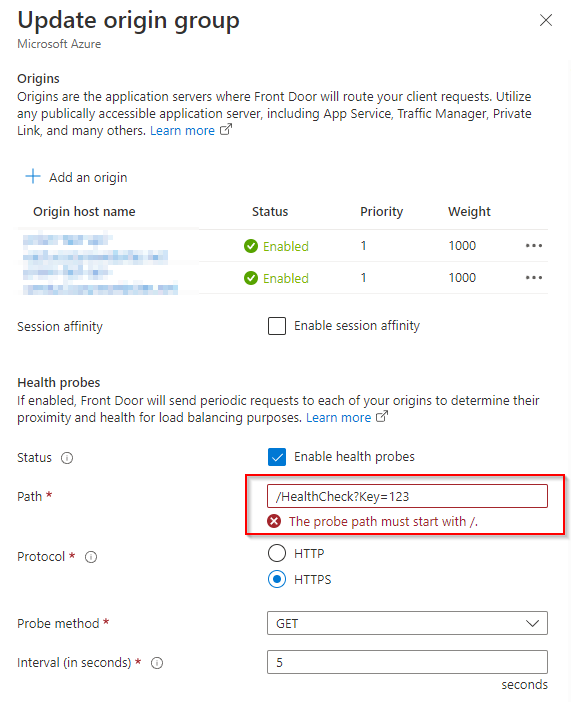
Example: Backend Health Drop
Metric Alert
BackendHealthPercentage < 90% for 5 minutes
Action Group:
- Notify Ops
- Trigger Logic App
- Auto-failover validation
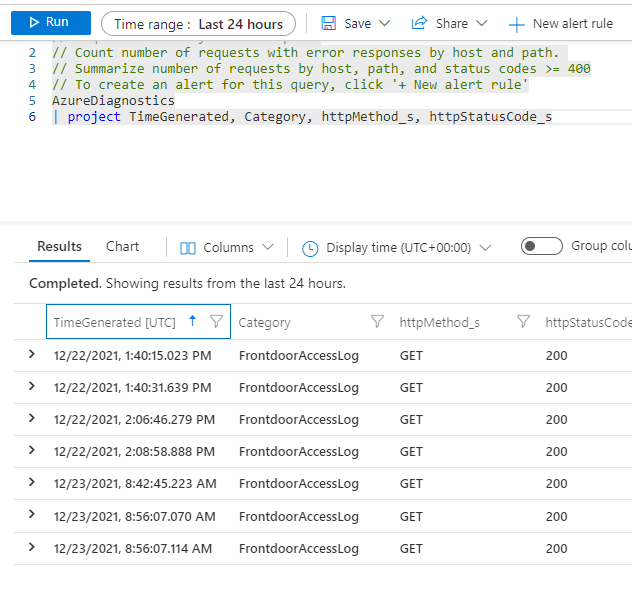
Example: Front Door Access Logs – High Latency
AzureDiagnostics
| where Category == "FrontDoorAccessLog"
| summarize AvgLatency = avg(timeTaken_s) by backendPoolName_s
| order by AvgLatency desc
Use case:
- Detect slow backends
- Compare regions (EU vs US)
- Support BCP routing decisions
Example: Traffic Source Breakdown
AzureDiagnostics
| where Category == "FrontDoorAccessLog"
| summarize Requests = count() by clientCountry_s
| order by Requests desc
Use case:
- Unexpected geo traffic
- DDoS or bot patterns
- Capacity planning
12. Azure App Service Monitoring
View the diagram on learn.microsoft.com
View the diagram on learn.microsoft.com
View the diagram on learn.microsoft.com
Metrics (Fast Alerts)
- CPU Percentage
- Memory Working Set
- HTTP 5xx Errors
- Requests/sec
- Response Time
Example: CPU Spike Without Performance Impact
Metric Alert
CPU > 80% for 10 minutes
Interpretation:
- App may still be healthy
- Correlate with request latency and error rate
Application Insights – Key Telemetry
- Requests
- Dependencies
- Exceptions
- Availability Tests
Example: 5xx Errors by Endpoint
requests
| where success == false
| summarize Failures = count() by name, resultCode
| order by Failures desc
Example: Dependency Failures (SQL / API)
dependencies
| where success == false
| summarize count() by target, type
Use case:
- Identify failing SQL, Redis, API calls
- Separate app vs platform issues
Example: Slow Requests
requests
| summarize AvgDuration = avg(duration) by name
| order by AvgDuration desc
13. End-to-End Correlation Example
View the diagram on learn.microsoft.com
View the diagram on learn.microsoft.com
Typical investigation flow:
- WAF – spike in blocked traffic
- Front Door – increased latency
- App Service – dependency timeout
- Application Insights – SQL slow query
- Action – scale App Service / tune WAF / fix DB index
14. Recommended Diagnostic Settings (Best Practice)
| Resource | Send Logs To | Retention |
|---|---|---|
| WAF | Log Analytics | 30–90 days |
| Front Door | Log Analytics | 30–90 days |
| App Service | App Insights + LA | 30 days |
| Metrics | Azure Monitor | Default |
| Archive | Storage Account | 1–7 years |
15. Summary – Why This Matters
With Azure Monitor configured correctly:
- WAF shows attack vs false positive
- Front Door shows edge & routing health
- App Service shows application behavior
- Application Insights shows code-level truth
Together, they provide full visibility from edge → app → dependency.