SERVICE OPTIONS
CUSTOM
PERSONALISED OFFER
INDIVIDUAL PRICE
We will customise our offer
to align with the specific needs of your company
CRM systems and data analysis.
Bezpieczeństwo infrastruktury firmowej.
CRM systems are IT tools that assist companies in building, maintaining, and developing relationships with customers and managing ongoing projects. They allow for the centralization of customer data, including their interaction history, preferences, and other vital information. These systems also automate business processes and provide easy access to clearly presented results and trends. Benefits of implementing a CRM system include:
Data analysis is a crucial process in a company that enables better decision-making based on factual information and statistics. This process involves various techniques and methods used to collect, process, and interpret data. Here are the main aspects of data analysis in a business context:
Data analysis has become a crucial tool for making strategic decisions in modern companies. The effective use of data can significantly impact business growth and competitiveness in the market.
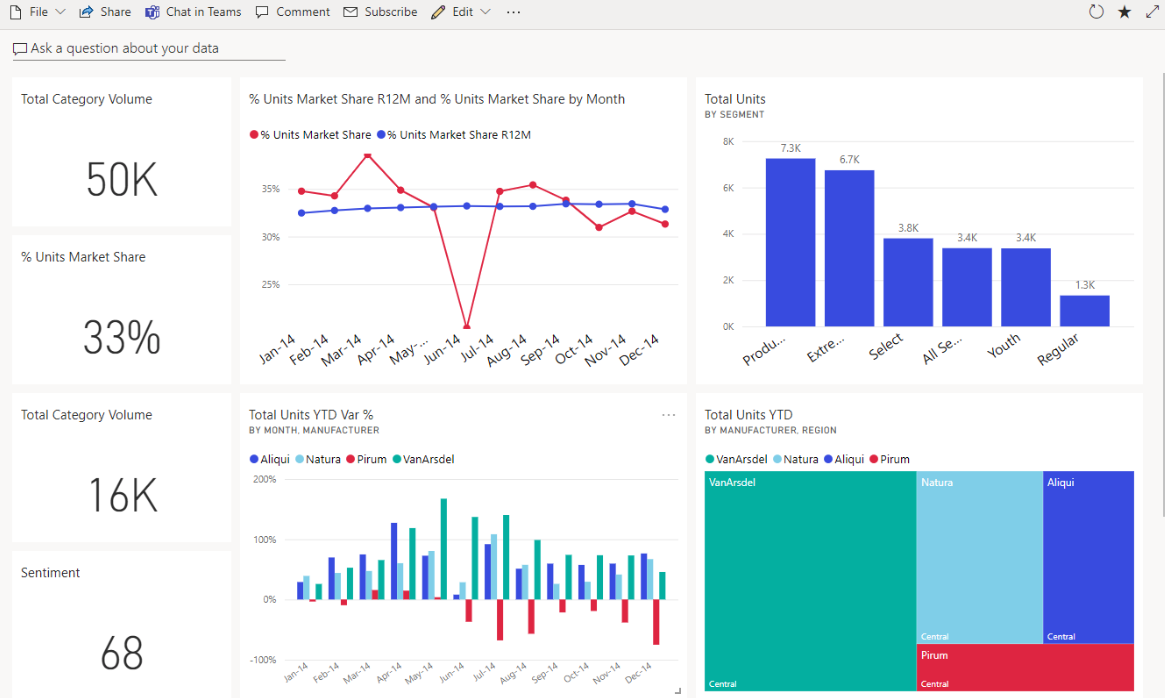
Sample


Evaluation, assessment, future outlook.
Microsoft® Power BI
Power BI is a data analysis and visualization tool created by Microsoft. It enables users to gather, process, and display data in clear reports and charts. The available functions of the program are:
Methods for data analysis

Data visualisation and accessibility.
With Power BI, users can access and interact with reports and dashboards across mobile devices, making critical data available anytime and anywhere to facilitate decision-making and collaboration among team members.
Power BI offers a variety of data visualisation options that allow you to read and understand your results quickly and easily.
